Nick Foles Has Been Much Better Than Mitchell Trubisky in This Very Important Facet
The Chicago Bears are 5-1 and leading the NFC North heading into arguably their biggest game of the season, a Monday night matchup against the 4-2 Los Angeles Rams. Of course, it’s easy to be happy with that but it’s also important to understand how the Bears got there and, perhaps more significantly, how they can stay there.
There have been many conversations around the quarterback position in Chicago, stemming back to 2017 when Mitchell Trubisky was drafted with the second overall pick. With a career 85.9 QB rating, you’ll have a hard time finding anyone who thinks that Ryan Pace didn’t fall flat on his face by trading up to draft Trubisky, an overall average QB at best.
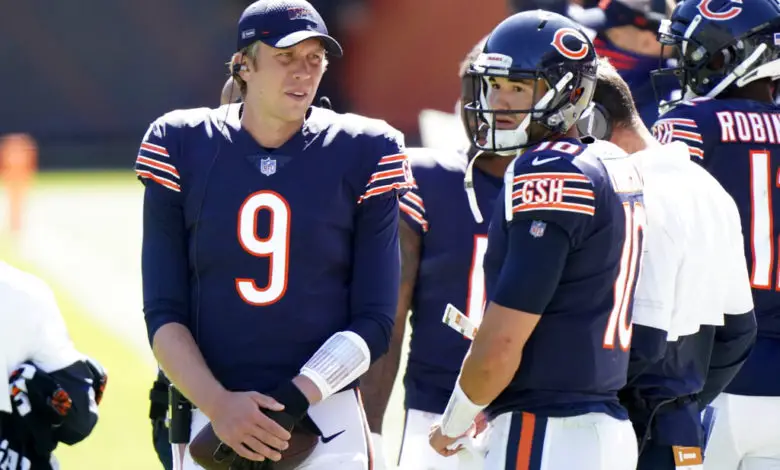
Nick Foles is now the Bears’ starting quarterback and, at first blush, it’s hard to tell the difference between him and the man he replaced. Let’s start with a quick comparison of their standard stats, with Trubisky’s 2019 season included to provide broader context.
| Cmp% | Yds/Gm | Int/Gm | Rating | Sks | Sks/Gm | |
| Foles – ’20 | 62.5% | 219.5 | 1 | 80.4 | 4 | 1 |
| Trubisky – ’20 | 59.3% | 186.7 | 1 | 87.4 | 7 | 2.33 |
| Trubisky – ’19 | 63.2% | 209.2 | 0.67 | 83.0 | 38 | 2.53 |
It’s pretty similar right up until you look at sacks. Trubisky gets sacked a lot more, over twice as much per game. Otherwise, the two QBs seem pretty comparable, right? I mean, if you were Matt Nagy trying to choose between these two QBs, it’s hard to differentiate the results on paper.
I wanted to dig in a little more, so I took a look at NFL Next Gen stats over the same time period. For those not quite familiar, Next Gen stats track numerous data points to enhance the understanding of a quarterback’s style and tendencies. The definitions are provided below so you can make a little more sense of the table.
TT = Time to throw the ball
CAY = Average completed air yards, where air yards is the vertical yards on a pass attempt at the moment the ball is caught in relation to the line of scrimmage
IAY = Average intended air yards
AGG% = Aggressiveness percent, which represents the amount of passing attempts a quarterback makes that are into tight coverage, where there is a defender within 1 yard or less of the receiver at the time of completion or incompletion. AGG is shown as a % of attempts into tight windows over all passing attempts.
| TT | CAY | IAY | AGG% | |
| Foles – ’20 | 2.49 | 5.3 | 7.7 | 21.7% |
| Trubisky – ’20 | 2.90 | 6.7 | 10.2 | 31.4% |
| Trubisky – ’19 | 2.64 | 5.1 | 7.9 | 17.8% |
The numbers between Foles in 2020 and Trubisky in 2019 are actually quite similar, with the biggest difference being in time to throw. Foles is around 6% quicker to throw in 2020 than Trubisky was in 2019, but we really start to see some compelling differences this season. Trubisky was holding the ball nearly 17% longer before throwing than Foles has this season. And what happens when you hold the ball longer in the NFL? You get sacked.
Trubisky was also trying to throw the ball into much tighter windows, which is a sign he wasn’t recognizing coverages or going through his progressions effectively. Foles does both of these things much better, particularly recognizing coverage. So he releases the ball quicker because he knows where he’s going based on pre-snap coverage reads.
When it comes to Foles and Trubisky, it’s not a question of which QB is more physically talented. The younger QB is probably a better all-around athlete, or at least a better runner. But Foles is clearly a more developed player when it comes to reading and reacting to defenses. He’s also a better leader, as we saw in his postgame interview this past Sunday.
If Trubisky does his homework and focuses on developing his ability to read defenses it’s possible he could be every bit as effective as Foles at QB. That probably won’t come with the Bears, but his career will continue in a different uniform. The real question is whether the Bears can continue to win with what’s clearly league-average QB play.