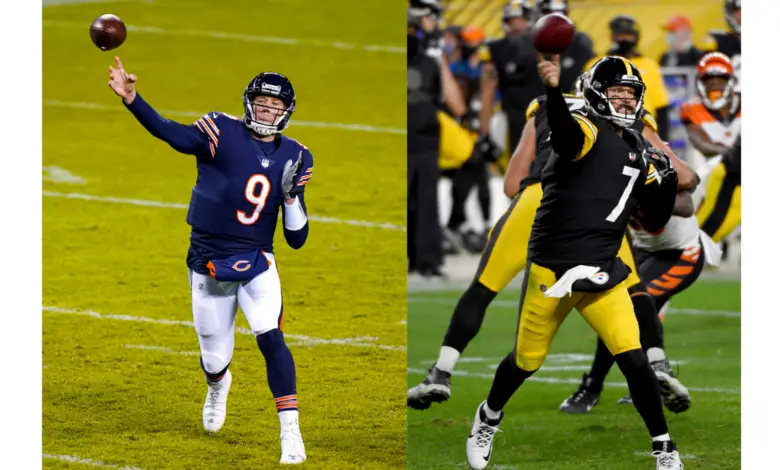
Nick Foles and Ben Roethlisberger Are Surprisingly Comparable QBs…Except for One Key Stat
I’m assuming you shook your head and then clicked just to see exactly how off-base that headline really is, so I’ll give you a moment to compose yourself. Well, believe it or not, Nick Foles is actually very comparable to Ben Roethlisberger in several areas. However, there’s one stat where Big Ben blows Foles away.
Below is a comparison of three different areas: Accuracy, Pressure, and Efficiency.
Accuracy
OnTgt% – Percentage of on-target throws per pass attempt
Bad% – Percentage of poor throws per pass attempt
Drop% – Percentage of passes dropped per pass attempt
| OnTgt% | Bad% | Drop% | |
| Foles | 76.1% | 15.7% | 3.0% |
| Roethlisberger | 78.3% | 15.4% | 6.6% |
Roethlisberger is slightly more accurate with his throws and both QBs have around the same percentage of bad throws. What jumps out here as somewhat surprising is that Roethlisberger has twice as many drops per pass attempt, which tells us the Bears pass-catchers have better hands than their Steelers counterparts.
Pressure
Sacks/Gm – Average sacks per game
Prss% – Percentage of times pressured per dropback
PktTime – Avg time QB has in the pocket until throw or collapse
| Sacks/Gm | Prss% | PktTime | |
| Foles | 2.0 | 21.4% | 2.2 |
| Roethlisberger | 1.0 | 16.4% | 2.1 |
The Bears’ offensive line has been in shambles all year and here’s where it shows up. Foles is being pressured more often and has been sacked twice as much as Roethlisberger. Pocket time is similar but that’s largely because Roethlisberger releases the ball so quickly, as you’ll see below.
Efficiency
TT – Average time from snap to throw on every pass attempt (sacks excluded)
CAY/PA – Completed air yards per pass attempt
YAC/Gm – Average pass yards after catch per game
| TT | CAY/PA | YAC/Gm | |
| Foles | 2.52 | 3.7 | 87.6 |
| Roethlisberger | 2.31 | 3.2 | 120.3 |
Here’s where things get really interesting. Both QBs are pretty quick to release the ball, with Roethlisberger ranking 1st among all QBs and Foles ranking 5th. Foles is actually throwing the ball farther in the air per completed pass attempt than Roethlisberger, but only slightly. The big difference here is in yards gained after a catch, where Roethlisberger is averaging over 37% more yards than Foles.
We know Foles is just as accurate as Roethlisberger, which in itself is a little surprising. We also know that Foles sees more pressure because of the problems with the O-line but, again, that’s not impacting his accuracy or air yards per pass attempt. So what’s the issue?
Among other little issues here and there, play design and execution are huge problems. The Steelers simply scheme and execute much better than the Bears do, hence their 30.1 points per game average (5th overall) compared to the Bears’ measly 19.1 points per game (31st overall).
At 20.9%, Foles ranks 3rd in the league in percentage of throws attempted into tight coverage (at least one defender within one yard or less of the receiver). Mitchell Trubisky is ranked 1st at 31.4%, making it pretty clear that receivers are not getting into space where they can make uncontested catches and then run for additional yardage. Is that because plays aren’t being run to beat the given coverages or because receivers and passes aren’t getting to the right spots?
It’s not clear root cause is simply just bad play designs, poor play-calling, or the inability to recognize defensive coverage and adjust accordingly. What is clear is that the Bears offense needs to be better, but that’s been the case for the last several weeks and there are no signs of improvement to this point.
The data used here was compiled using Pro-Football Reference and NFL NextGen stats.